Virtual Cell Challenge 2026: Winners and Wrap-Up
How Close Zero-Shot Models Came to a Replicate Experiment
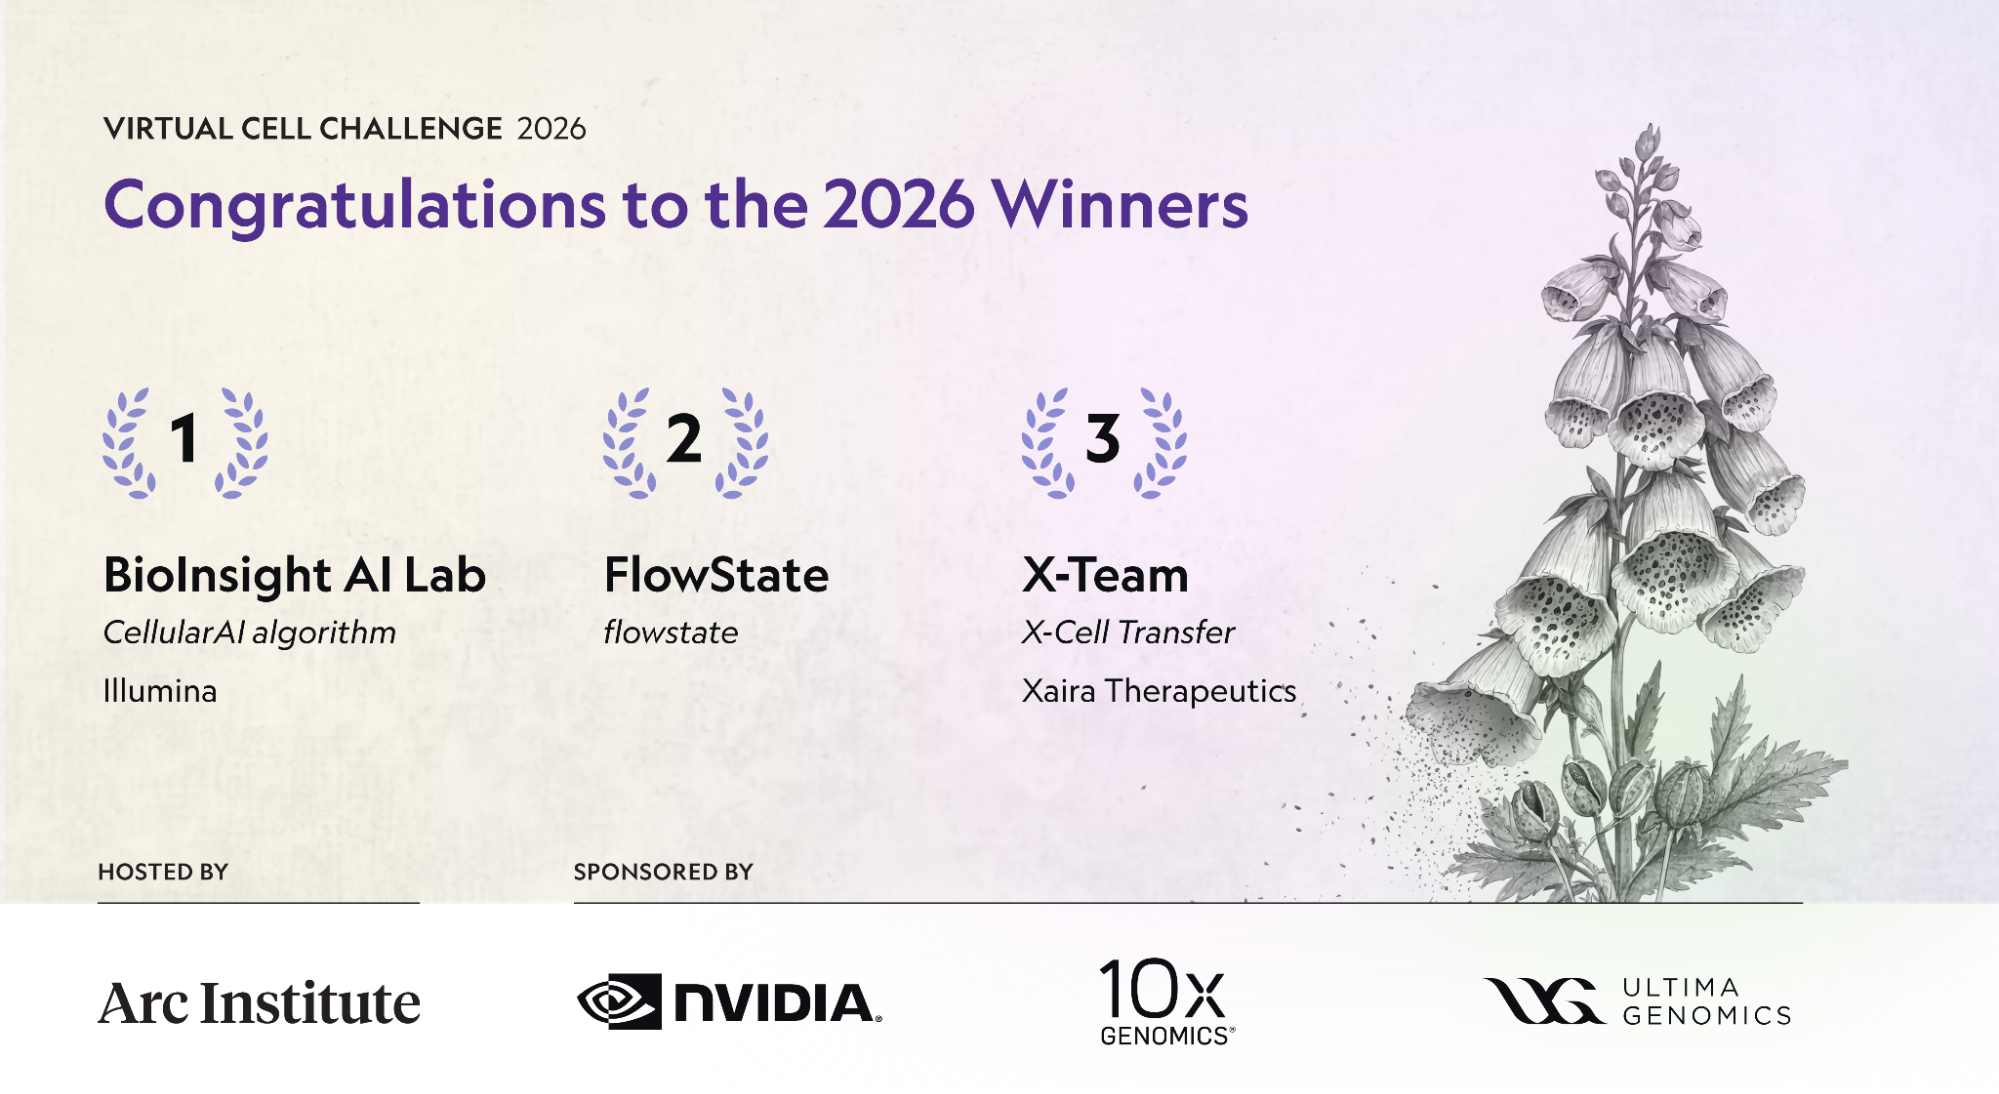
We thank everyone who took part in the second Virtual Cell Challenge. More than 5,441 people registered, 1,469 teams posted 26,827 submissions to the validation leaderboard, and 805 teams made a final entry. This year's winning teams are BioInsight AI Lab from Illumina (first place), FlowState (second place), and X-team from Xaira Therapeutics (third place). We are very pleased to congratulate all three.
By design, this year's task was harder than last year's. Models were asked to predict, given only the unperturbed control cells of each cell line, the transcriptional response to 300 CRISPRi knockdowns in three cell lines for which there were almost no perturbation data publicly available. The winning entry, CellularAI Algorithm from Illumina, scored 0.440 on these three held-out lines. On our scale, 0 corresponds to the cell context mean (i.e. the average response observed across knockdowns) and 1 corresponds to an independent replicate of the experiment. Averaged over six metrics and three cell lines, the winning predictions therefore covered 44% of the distance between the cell context mean and a replicate. It should be noted that this number does not represent accuracy and that individual metrics vary widely around this average.
Importantly, these results should be read against a strong reference point. Most of the 300 test targets had already been knocked down in other cell lines in public data. Simply carrying these measured responses over to the control cells of a new line, without any learning, recovers a large part of the perturbation-specific signal, since much of the downstream signature of a knockdown is shared across cell types. All three winning teams built on this type of reference transfer, and they differed mainly in how they weighed the evidence, adapted it to a new line, and converted the predicted effects into cells.
So, how close did zero-shot models come to a replicate experiment? Models significantly improved over last year but we still have a long way to go!
What we asked this year
In 2025, models were given perturbation data from H1 human embryonic stem cells and asked to predict the effects of held-out perturbations in the same cells. In contrast, this year's Challenge had no training set. For each cell line, we released only the unperturbed control cells (18,400 cells from 46 non-targeting guides) along with the list of genes to knock down, and models had to predict the expression profiles of 400 cells for each knockdown.
We selected six cell lines that differ in their tissue of origin, lineage and disease state, and split them into two sets. The validation lines, Cal-33 (head and neck squamous cell carcinoma), HeLa (cervical adenocarcinoma), and Jurkat (T-cell leukemia), drove the live leaderboard, while the test lines, AC16 (cardiomyocyte), MOLM13 (acute myeloid leukemia), and U-87MG (glioblastoma), determined the final ranking. The test panel included 300 knockdowns, 129 of which were shared with the validation panel and 171 of which were new.
This design follows from the success criterion that we set out in our September commentary in Cell, namely that a useful prediction should be "meaningfully closer to the human response than the state-of-the-art preclinical experimental models alone." In this framework, held-out cell lines are a tractable stand-in for the contexts that we cannot perturb directly. In this context, zero-shot means that the Challenge provided no perturbation data from these six lines; it does not mean that the models had never seen the perturbed genes, since teams were free to train on any public or private dataset. All but one of the 300 test targets had public perturbation data in some other cell line: 277 in the genome-wide K562 screen of Replogle et al. (2022) and 298 in the X-Atlas/Orion screens of HCT116 and HEK293T. In addition, 21 were targeted in U-87MG by the kinome screen of McFaline-Figueroa et al. (2024). For this reason, in the Winners section below, we describe the training data that each of the winning teams used.
A high-quality dataset
As we described in our Behind the Data post, this year's dataset is the product of six months of work across multiple Arc Technology Center teams (Functional Genomics, Molecular Engineering, Multiomics Profiling, the Next Generation Sequencing Platform, Bioinformatics, Infrastructure, and Machine Learning). In each of the six lines, we profiled more than 10,000 CRISPRi knockdowns. In total, our experimental teams handled more than a billion cells in order to produce deeply sequenced profiles from more than 30 million cells (with a median of 20,000 UMIs per cell and more than 800 billion UG100 reads per cell line). For the Challenge itself, we retained knockdowns with at least 80% median on-target reduction and subsampled each to 400 cells, so that coverage, depth and knockdown efficiency were consistent across all six lines.
The six metrics
Two lessons from 2025 shaped this year's metrics. First, MAE effectively dropped out of last year's competition because almost every model scored worse than the mean baseline. Second, Team Outlier showed that the L1-based perturbation discrimination score rises with the scale of a prediction (arXiv 2511.16954), which is why we moved to a cosine-based version this year.
In collaboration with NVIDIA, we developed cell-eval2, which uses six metrics that collectively cover perturbation discrimination, expression error and the recovery of differentially expressed genes. In all six metrics, the knocked-down gene itself is excluded. All entries were scored on these metrics:
- PDS asks whether each predicted effect is closer to its own measured effect than to those of the other knockdowns.
- MSE measures the squared expression error relative to the size of the real effect, after removing sampling noise.
- NMAE measures the error in predicted log fold changes for the genes that truly change, relative to predicting no change.
- FIDELITY asks whether the genes that a prediction calls differentially expressed change in the correct direction, with credit scaled by whether the prediction calls as many genes as the real data.
- REACH asks how far down a prediction's own significance ranking of genes the predicted directions remain correct, relative to the number of genes that truly change.
- JACCARD measures the overlap between the predicted and measured sets of significant genes.
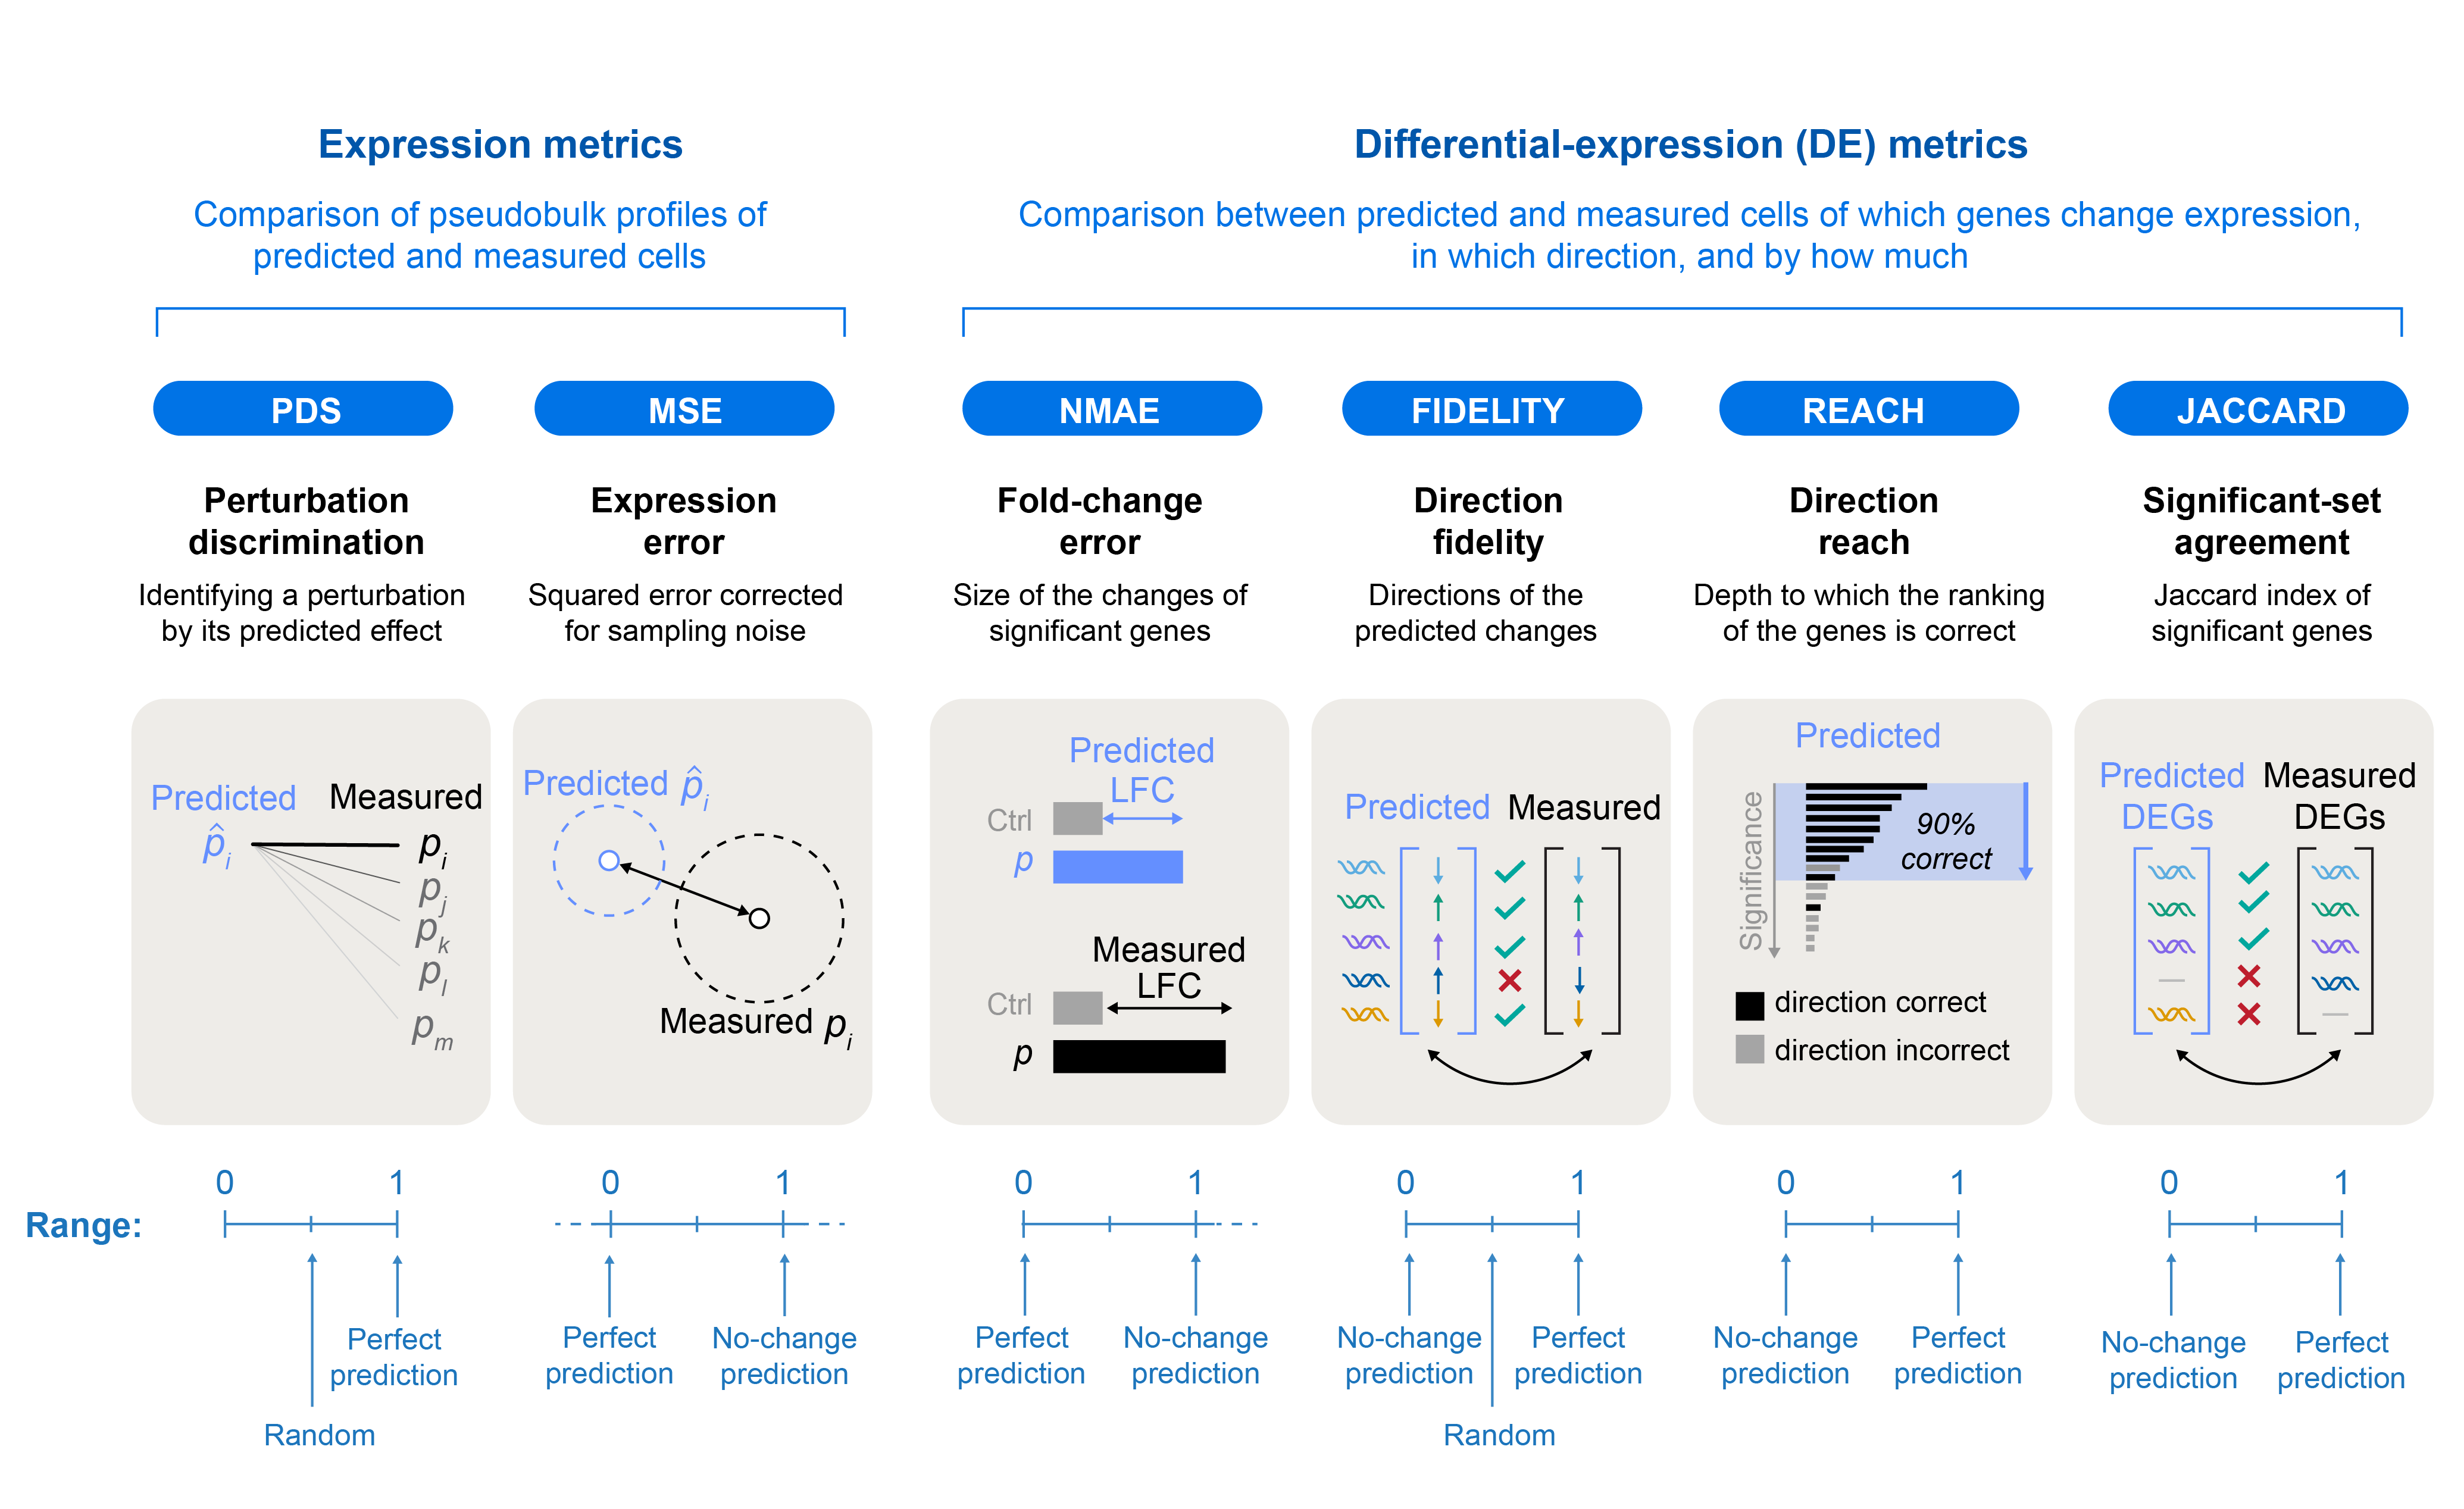
Each metric is scaled within its own cell line between the cell context mean (0) and the mean of five random half-splits of the real data (1), and the overall score is the unweighted average across six metrics and three lines. Because the replicate reference uses only half of the cells, a prediction can score above 1 on a given metric, whereas a score below 0 indicates that the prediction performed worse than the cell context mean. The exception is MSE, which is clamped between 0 and 1 in each line. Full definitions are available on the evaluation page and a new preprint prepared by the lead architect of the Challenge metrics, Alexander Dobin, Arc’s Director of Bioinformatics.
Results
| Rank | Team | Final test score |
|---|---|---|
| 1 | BioInsight AI Lab | 0.4399 |
| 2 | FlowState | 0.3348 |
| 3 | X-team | 0.3263 |
| 4 | Obradovic Lab | 0.3243 |
| 5 | C-team | 0.3193 |
| 6 | Aginglab.com | 0.3175 |
| 7 | TAO | 0.3150 |
| Metric | BioInsight AI Lab | FlowState | X-team |
|---|---|---|---|
| Overall | 0.4399 | 0.3348 | 0.3263 |
| PDS | 0.8313 | 0.8363 | 0.7346 |
| MSE | 0.6842 | 0.3632 | 0.4681 |
| NMAE | 0.4399 | 0.3286 | 0.3038 |
| FIDELITY | 0.1908 | 0.1695 | 0.0659 |
| REACH | 0.4288 | 0.3128 | 0.3186 |
| JACCARD | 0.0642 | -0.0018 | 0.0667 |
Scoring higher than the context mean varied in difficulty for the six metrics. Among the final entries, more than nine in ten scored above the cell context mean on PDS and REACH and more than eight in ten on NMAE, but only about six in ten did so on FIDELITY, about four in ten on MSE and about a third on JACCARD, where even the best entry scored only 0.07.
Validation and test sets used different cell lines and different panels, which means that their scores are not directly comparable, however, the rankings carried over well. Across the 638 teams that remain on both leaderboards, validation and test scores were correlated (Spearman coefficient of 0.78), although this correlation fell to 0.49 among the 20 that ranked highest on validation. Illumina AI held first place on both boards, X-team moved from second to third, and FlowState moved from fifth to second. Because teams could see their per-line test scores while the test board was live, the final ranks also reflect re-uploads, although among re-uploads of files that already scored 0.27 or more, the median gain was only 0.0004 (and the largest, 0.043).
The winning teams
We are very pleased to congratulate the following teams:
🥇 First Place, $100,000: BioInsight AI Lab
🥈 Second Place, $50,000: FlowState
🥉 Third Place, $25,000: X-team
Each Prize is paid half in cash and half in NVIDIA Brev credits.
Below we provide details about each team and their models. Since open weights and code were not required this year, the descriptions are based on information provided by each team. We provide our own analysis of the top models in the section “What we learned” below.
🥇 First Place, $100,000: BioInsight AI Lab
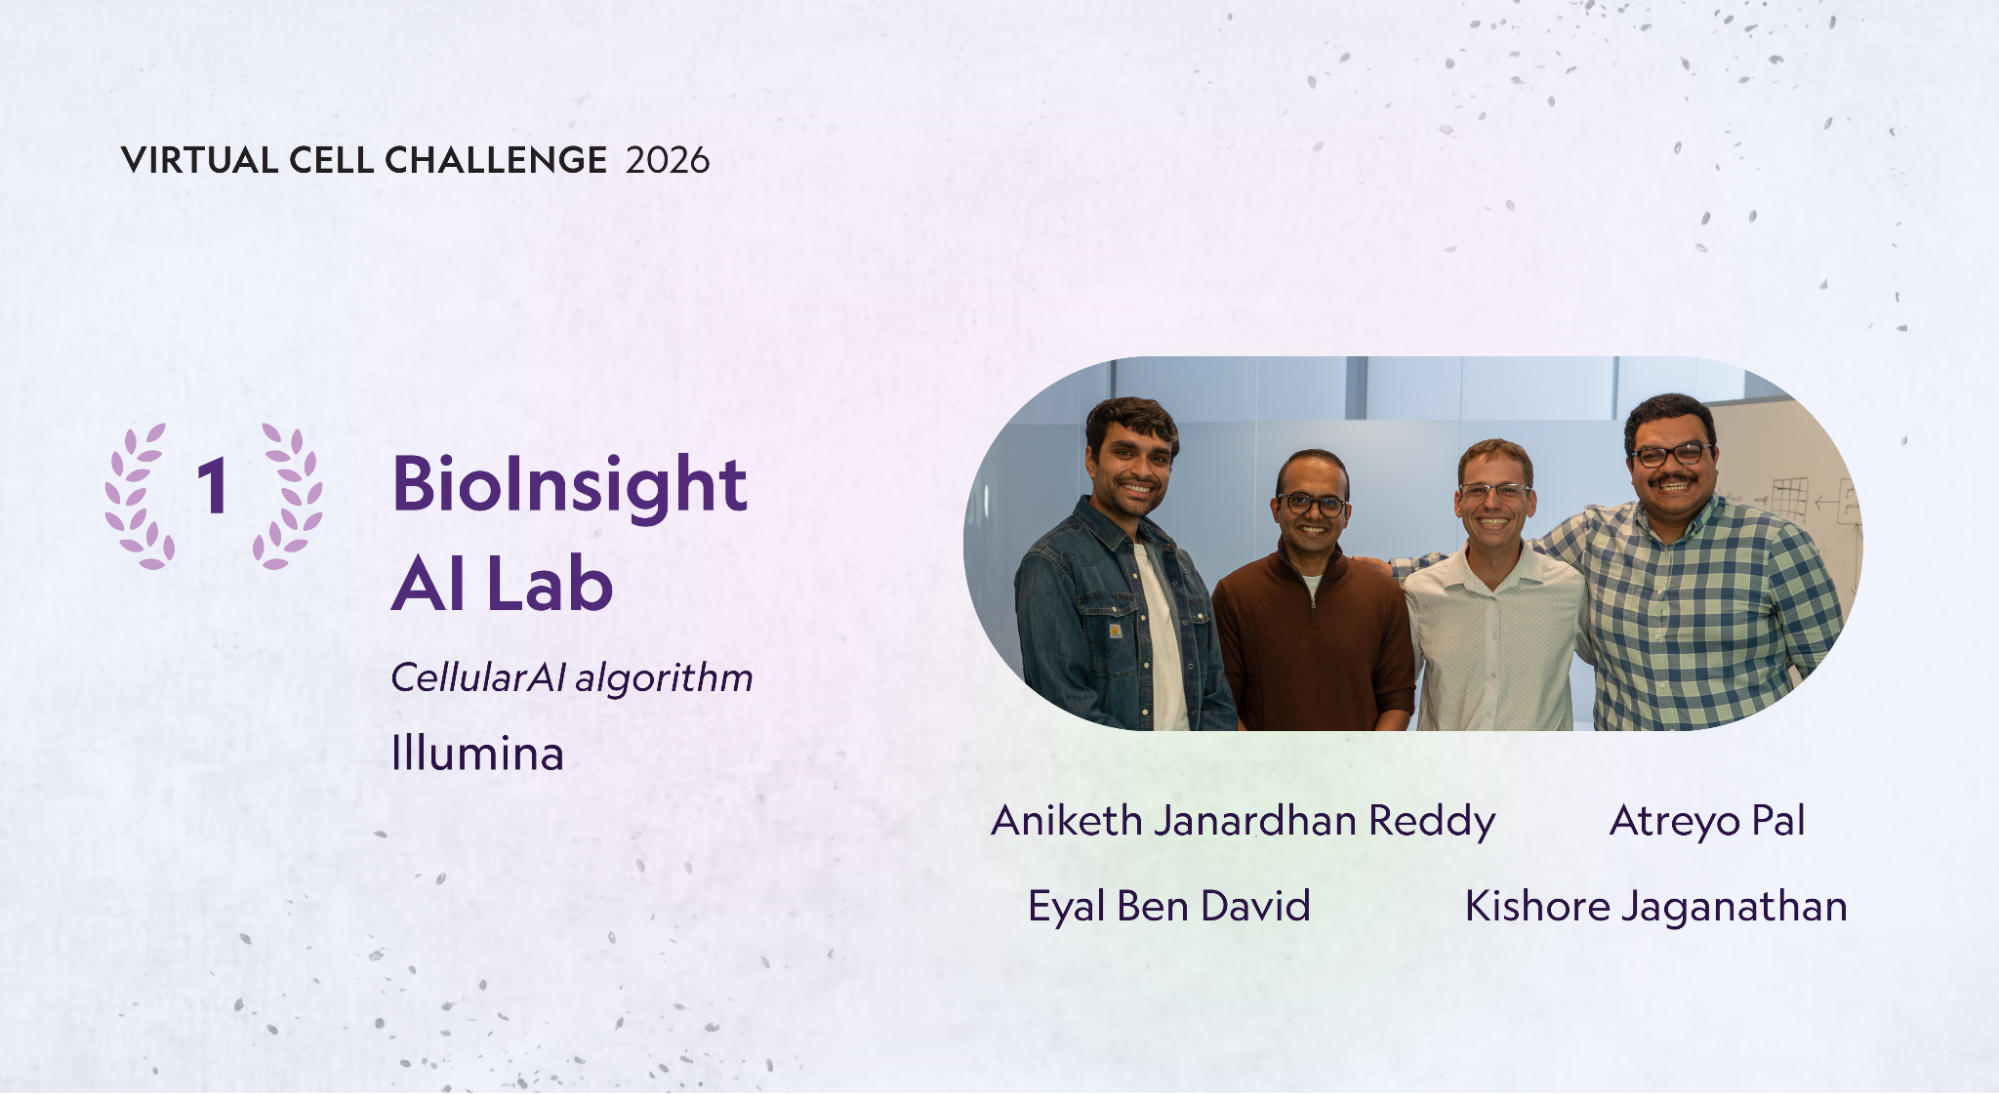
Members: Aniketh Janardhan Reddy, Atreyo Pal, Eyal Ben David, and Kishore Jaganathan
Organization: Illumina
Model: CellularAI algorithm
The CellularAI algorithm is a statistical transfer framework that first predicts summary statistics for the new cell line and then builds cells that follow them. The team analyzed each training dataset with covariate-adjusted regression to obtain a log fold change, its standard error and its significance for every gene and perturbation and centered these estimates across perturbations to correct for inflation. These estimates were then combined into a consensus prediction for the unseen line using a random-effects meta-analysis, in which each dataset receives gene- and perturbation-specific weights that reflect how closely its control cells resemble the new line, how variable and noisy its estimates are, and how efficient the knockdown was. Because the meta-analysis also estimates how much the datasets disagree beyond their own noise, no single dataset dominates when the sources conflict.
In the second step, the consensus is adapted to the new line. To this end, the team used singular value decomposition to identify the main response patterns across datasets and fit a ridge regression model that learns how the control expression of a dataset shifts its log fold changes along these patterns; the control profile of the new line then yields a correction to the predicted effects. Finally, the CellularAI algorithm estimates which genes are likely to show a detectable response and synthesizes virtual cells by distributing the predicted log fold changes across the control cells of the line, taking into account their expression levels, sequencing depths and cell-to-cell variation.
For training, the team used the Illumina Billion Cell Atlas, the perturbation atlas that Illumina launched in January, along with three published genome-scale CRISPRi Perturb-seq datasets in induced pluripotent stem cells (Nourreddine et al., 2026), human pluripotent stem cell lines (Feng et al., 2026) and primary CD4+ T cells (Zhu et al., 2026). They developed the method iteratively against local benchmarks built on the 2025 Challenge data, Replogle et al. (2022) and held-out internal datasets, pairing human-driven work with automated optimization by LLM-based research agents running on eight NVIDIA H200 GPUs and selected the final model using the Challenge validation data. Prediction and cell synthesis ran on CPU nodes.
🥈 Second Place, $50,000: FlowState
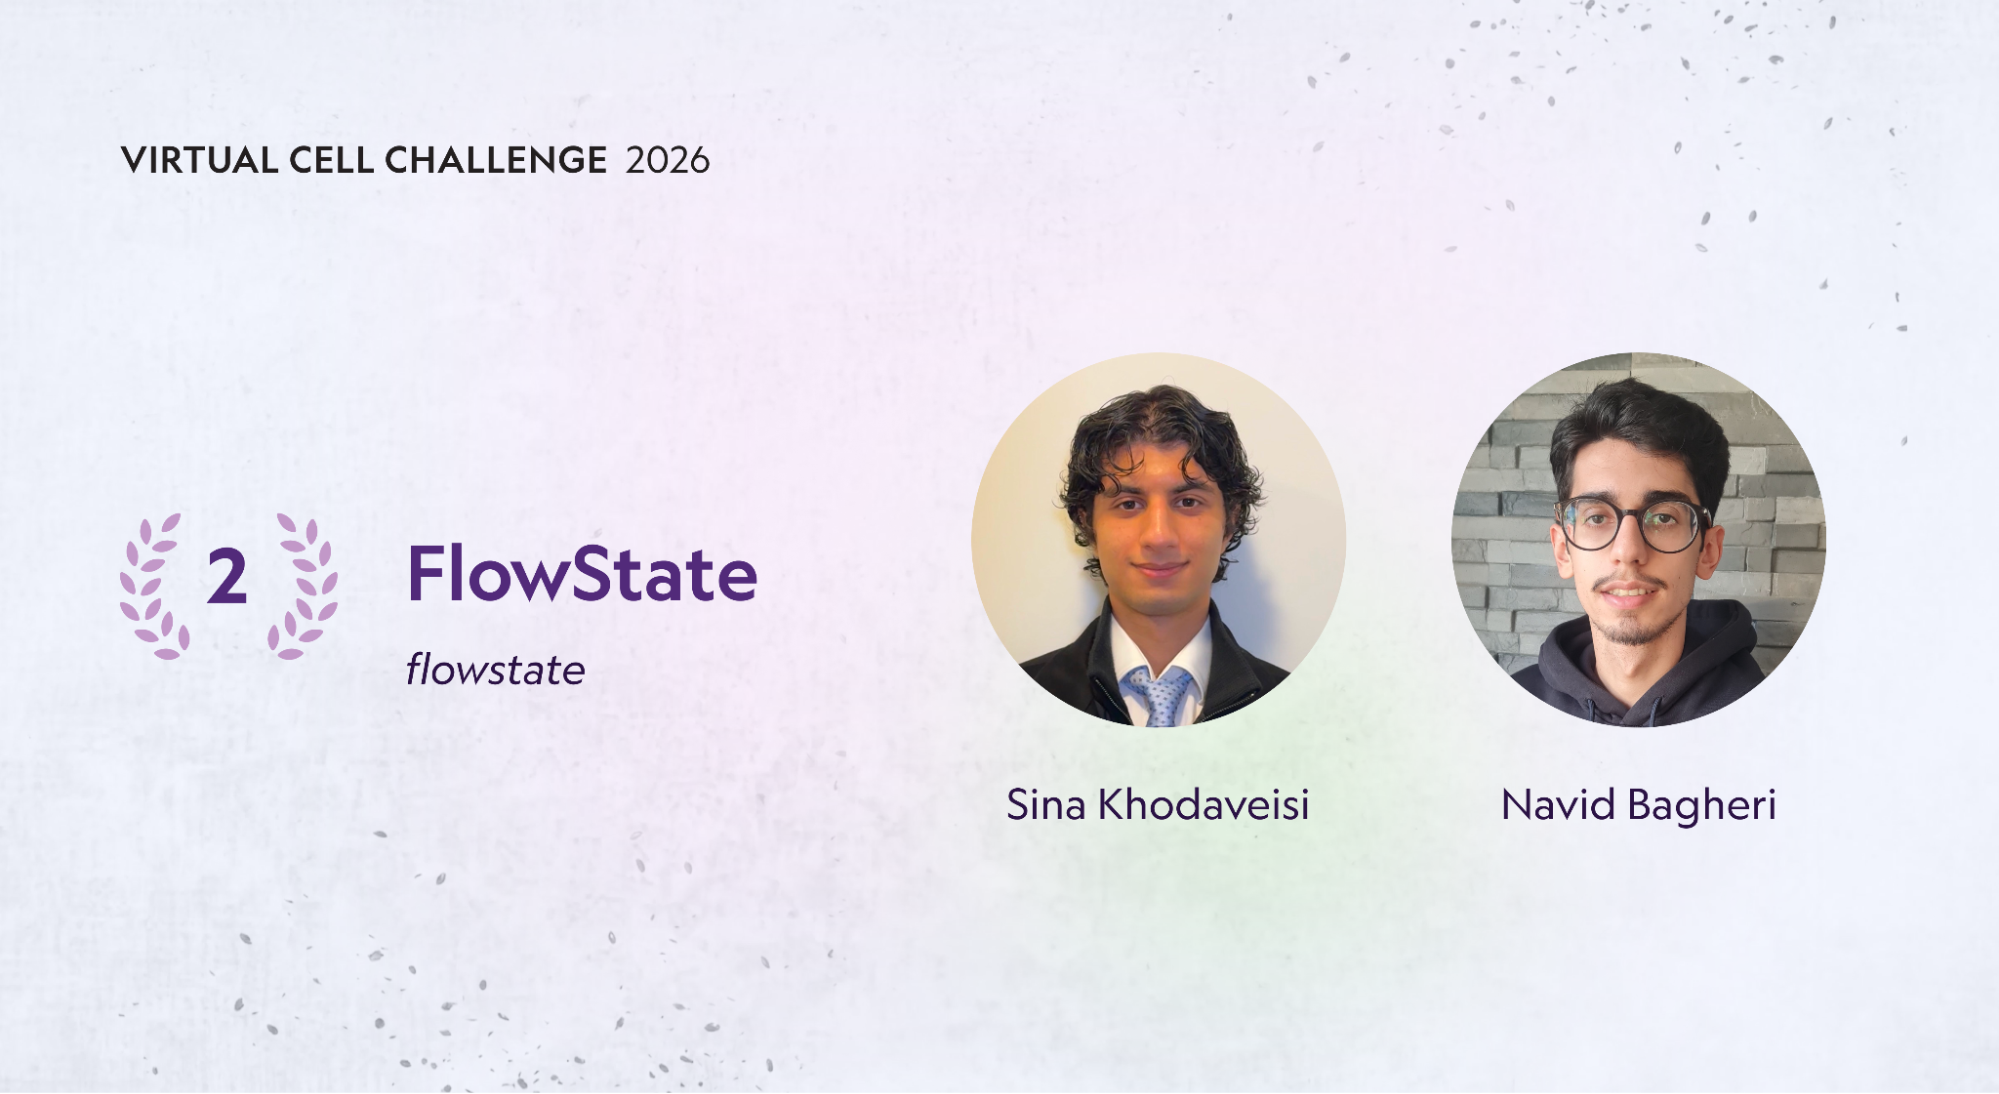
Members: Sina Khodaveisi and Navid Bagheri
Organization: Independent Researchers
Model: flowstate
flowstate was trained exclusively on public data, namely 222 perturbation-response datasets from 128 studies that cover 86 cellular contexts. About half of these are single-cell screens (e.g. Replogle, Adamson, Nadig, X-Atlas/Orion, HipSci, VIPerturb-seq, IGVF, and the 2025 Challenge data), and the rest are bulk knockdown and knockout studies from resources such as ENCODE, LINCS, PerturbAtlas, KnockTF and ARCHS4, spanning CRISPRi, CRISPR knockout, siRNA, and shRNA. The team converted every dataset into a single representation (i.e. the per-gene change in expression relative to the controls of that experiment, along with its uncertainty), after harmonizing gene identities, correcting for coverage, sequencing depth and assay chemistry, and reducing study-specific effects.
The model, which the team built without any published or pretrained model, divides the task into an effect model and a cell generator. The effect model takes as input the perturbed gene and the untreated cells of the new line, which the team treats as a prompt for adapting what the model learned during training to the new context. Three heads, each trained on held-out cell contexts so the model never sees the line it predicts, then make the prediction: one scores how strongly each gene responds, one sets the direction of the response and one sets its magnitude. Training was stabilized by weighting each dataset by its reliability and shrinking noisy estimates. The cell generator then converts the predicted effects into cells by adjusting the counts of the supplied control cells, so that the predicted effect holds both across the whole population and in individual cells.
🥉 Third Place, $25,000: X-team

Members: Jinyeop Song, Tanush Kumar, and Julie Chow
Organization: Xaira Therapeutics
Model: X-Cell Transfer
The submission from X-team uses X-Cell Transfer, a prediction pipeline built around Xaira’s X-Cell virtual cell model that combines model predictions with reference perturbation data and statistical calibration. X-Cell is a masked diffusion model over sets of cells that takes a target gene and a sample of unperturbed cells from a given context and predicts the perturbed expression state, using cross-attention to embeddings of prior biological knowledge. For the Challenge, the team used a version with linear attention over the full gene panel, trained on more than 37 million cells from in-house Perturb-seq data (including X-Atlas/Pisces) and external screens, with auxiliary objectives that reward agreement on differentially expressed genes and the retrieval of the measured response of each perturbation. X-Cell was not further adapted to the Challenge data.
The team did not submit the raw output of X-Cell. Since X-Cell is trained to match the mean of per-cell log-normalized expression, whereas the Challenge evaluates effects on log-transformed pseudobulk expression, its direct outputs carried a systematic bias in new contexts. To address this, the team anchored its predictions to measured effects from reference CRISPRi screens, which were pooled with weights for cell count and for the similarity of the control cells of each screen to the new line, and with caps on the influence of any single study. The predictions of X-Cell, gated by model confidence and by directional agreement, then determine, gene by gene, how much of each reference effect carries into the new line. A small gradient-boosted classifier predicts which genes are likely to be significantly differentially expressed, and guides both the calibration of effect sizes against the sampling noise of a 400-cell control pseudobulk and the construction of 400 synthetic cells from sampled control cells. For selected genes that are not yet significant under the statistical test used by the Challenge, counts are then redistributed between cells while the total for each gene is held fixed, so that the pseudobulk effects remain unchanged.
What we learned
Notably, all three winning entries were modular pipelines rather than single end-to-end models that map a control state and a perturbation to a population of cells. Each team first estimated the effect of every knockdown on pseudobulk expression from measured responses to the same knockdown in other cell types, adapted these estimates to the new cell line using only its control cells, and then generated the 400 cells by modifying the control cells of the line itself. The next two entries on the leaderboard, Obradovic Lab and C-team, similarly combined cross-line transfer of measured responses with learned components.
The teams differed mainly in how they weighed this evidence. BioInsight AI Lab used a random-effects meta-analysis with weights for context similarity, noise and knockdown efficiency, and FlowState learned shared response programs from a broad public corpus with separate heads for ranking, direction and magnitude. In contrast, X-team used a large pretrained foundation model to decide which measured effects should carry into a new context and how strongly. All three teams also treated uncertainty explicitly, weighting their sources by noise and by how closely their control cells resemble the target line. Future ablation studies are needed to determine how much each component contributed; however, the pattern suggests that, for now, reference data and how carefully it is transferred to a new context matter at least as much as model architecture.
Moreover, a podium finish did not require private data. While BioInsight AI Lab and X-team drew on large in-house perturbation atlases, FlowState placed second using public data alone, indicating that broad and carefully harmonized public data can be competitive with large private atlases on this task. Last year, the winning approaches combined deep learning with classical statistical features; this year, the balance tipped further toward explicit statistical transfer, and the only foundation model on the podium was used to select and scale measured effects rather than to generate cells directly.
Converting predicted effects into cells has also become part of the modeling problem. Every winning team engineered this step carefully, and in our own analysis, redrawing the cells under the same pseudobulk prediction changed a score by up to 0.004, which exceeds the gap between third and fourth place this year.
Where models fell short
On the validation lines, the top ten entries predicted nearly the same response to a given knockdown in every line. Among the genes that respond significantly to a knockdown in a given line, the cosine similarity between the predicted responses to a target in different lines ranged from 0.77 to 0.89, compared with 0.55 for the measured responses and 0.91 to 0.95 for two independent samples of cells from the same line, and the line-specific component of the response that the models did predict was small (a slope of 0.02 to 0.13, compared with 1.02 for a replicate). On the same genes, the predicted responses agreed with the measured ones at 0.38 to 0.52, compared with 0.55 for the response to the same knockdown measured in a different validation line. Together, these observations indicate that current models recover roughly what a cross-line average would predict, whereas the part of the response that is specific to a cell line, which is precisely what a virtual cell model would need in order to improve on an experiment in another model system, remains largely missing.
Furthermore, the models called far too many genes as differentially expressed. On the validation lines, the measured responses yield a median of 22 to 44 significant genes per target, whereas the predictions from X-team called 122 to 136, those from BioInsight AI Lab about 500, and those from the rest of the top ten ranged between 340 to 4,200.
Performance also tracked the breadth of the responses. In U-87MG, the median response involves 102 genes, compared with 25 and 32 in the other two test lines, and the field scored lowest in this line (a median of 0.066 across the final entries, compared with 0.146 and 0.125).
Finally, the field lost ground on the 171 test targets that were absent from the validation panel, where per-target PDS fell by 0.025 on average. Hill climbing on the validation leaderboard is one possible explanation, although the number of validation submissions made by a team does not predict how much it lost.
Looking ahead
The Virtual Cell Challenge will return next summer. In the meantime, you can:
- Sign up for Arc Institute updates
- Check out the 2026 metrics preprint
- Apply for a machine learning role at Arc
- Explore our Tools, including State, Stack, and PIE
- Explore our open datasets in the Virtual Cell Atlas
Acknowledgments
We thank every participant for the creativity and the scientific discussions that shaped this year's Challenge, and we congratulate our winners on their exceptional work. We are also grateful to the community analysts whose work changed how we score the Challenge, to NVIDIA, who sponsored the Challenge, helped build cell-eval 2 with us and provided the Brev credits, and to 10x Genomics and Ultima Genomics, whose Flex and UG100 platforms, respectively, we used to generate this year's data. Special thanks go to the Arc Technology Center teams who generated the data and to the Virtual Cell Challenge team at Arc.